What is Grafana?
Grafana is an open-source platform for running data analytics and pulling up metrics that make sense of the massive amount of data in a pleasing way. Grafana is capable of connecting with most data sources such as PostgreSQL, Influx DB, Graphite, Prometheus, ElasticSearch, MySQL, etc.
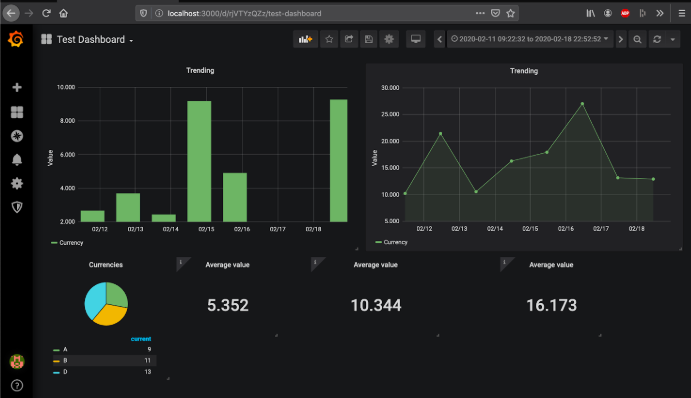
The main feature is users can create dashboards with panels. Each panel represents specific metrics over a set time-frame. Grafana supports single stats (text values), graphs, tables, heatmaps, logs, alert list, and dashboard lists as well as integration with various plugins. Every dashboard and its panel could be customized for a specific project or any development/business needs. Another plus is that users could add annotations into the panels to track specific events and reference to their consequences (data usage, new releases, errors, etc.).
Dashboard and Panel
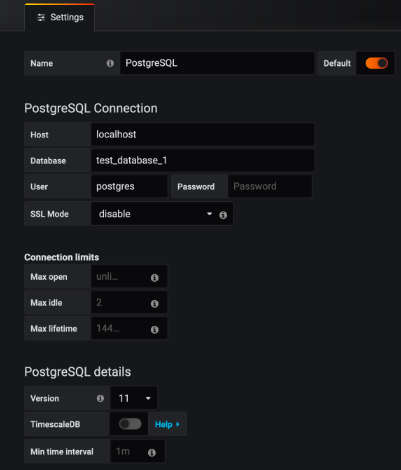
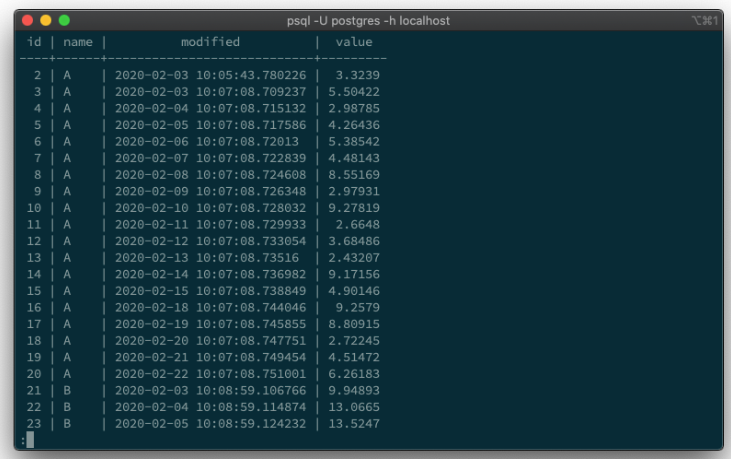
Before creating a dashboard, the user is required to add the data source. In other words, the user needs to connect Grafana with a target database such as PostgreSQL.
As mentioned, the dashboard is a collection of panels where each panel represents some kind of visualization.
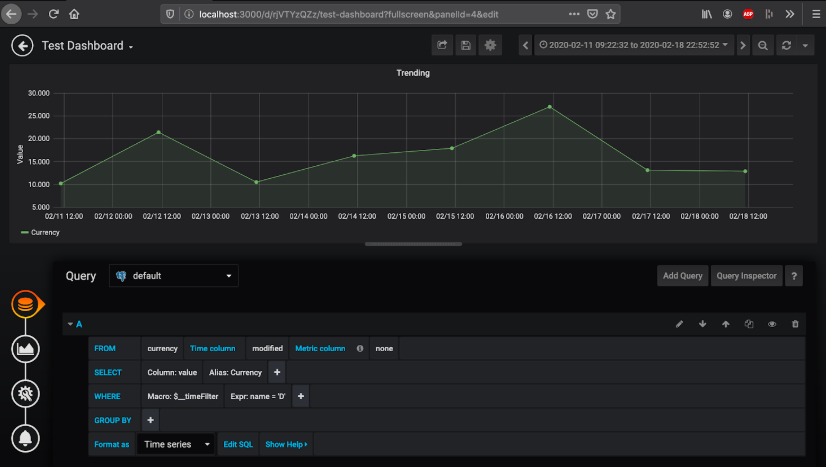
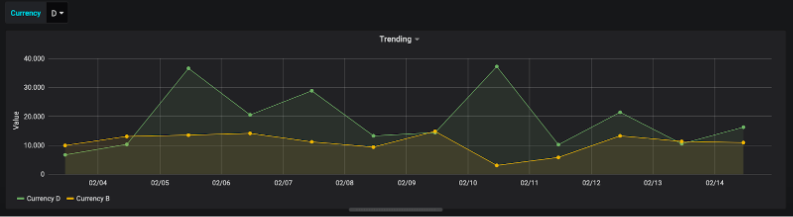
Grafana offers a set of options so the user can adjust the panel by its needs. The example above represents a line chart (with points) that shows the trending price of imaginary currency D in a period of time (2.3). Once the query is defined using the built-in query builder or custom query, it is very easy to modify style and visualization.
Another benefit is that Grafana allows multiple queries per single panel so we can track trending prices of imaginary currencies in real-time.
Iframe and Variables
One of the benefits is that Grafana panels can be used as IFrame and easily embedded to e.g. clients web applications. That feature allows the presentation of visualizations on the web application without any need for the additional third-party library such as Chart.js
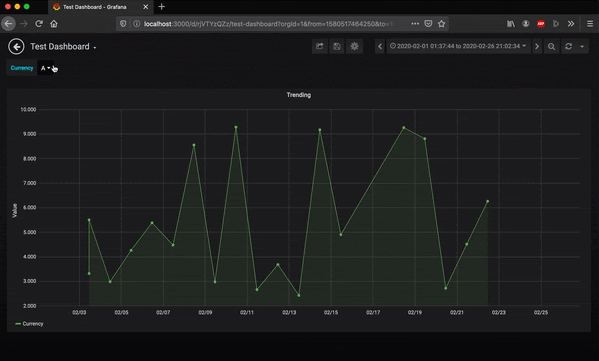
Another advantage is the usage of variables. A variable is a placeholder for a value and it allows for more interactive and dynamic dashboards. Instead of hard-coding things like server, application and sensor name in your metric queries you can use variables instead. You can also use variables in metric queries and in panel titles. So when you change the value, using the dropdown at the top of the dashboard, your panel’s metric queries will change to reflect the new value.
Why should you use Grafana?
If your business requires data monitoring, data visualization or realtime tracking then Grafana is the right choice for you. Because it is an open-source platform, it does not cost you a penny but it gives you a lot of features, decent documentation, great community and most importantly easy to read visual representation of your most important data.
FarShore Partners has skilled experts when it comes to Grafana implementation, especially when it comes to real-time monitoring and visualization of time series data. Feel free to contact us and we’ll be happy to assist!